Total blocking time (TBT) is one of the important web vitals of the lab metrics as per page speed insight (PSI). The same is replaced as the first input delay (FID) in the field data of PSI.
This metric measures how responsive a page is to load. User experience is smoother when the website reacts to user input more quickly than it should. Websites with higher TBT values usually need more ability to respond to user input as soon as they should.
In 2020, TBT was introduced as one of the lighthouse performance metrics. It helps to understand the user experience of the web page.
When your website or web pages has high TBT, it can directly impact the user experience and eventually hurts the SEO performance.
What Is Total Blocking Time (TBT)?

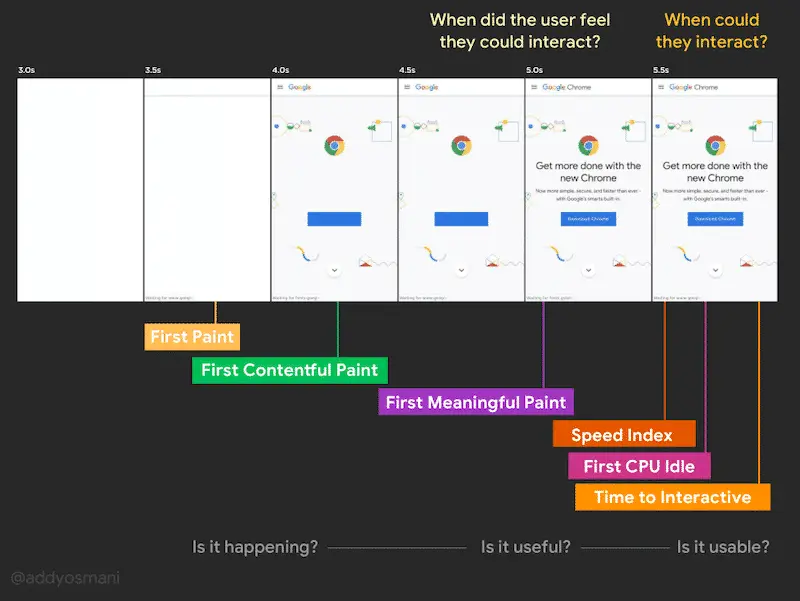
Total Blocking Time (TBT) measures the total time between First Contentful Paint (FCP) and the Time to Interactive (TTI). The TBT increases with the blockage in the main thread and delays the input responsiveness.
In simple terms, TBT is the time taken when a long task blocks the main thread of the web page. Usually, any task that takes more than 50 ms is termed a long task.
TBT is one of the six metrics used by Page Speed Insight of Lighthouse. It has a 30% of weightage in the overall page speed insight score.
So, let’s first decode the main thread.
The main thread is a vital component for the rendering of web pages. Once the browser receives the code scripts of the page, the main thread parses the HTML code into DOM (Document Object Model). Besides this, it parses CSS codes to determine the style for every element.
Here are a few tasks of the main thread:
- Parse HTML
- Construct DOM
- Produce Layout Tree
- Parse CSS
- Parse JavaScript
As you understand, the main thread has to process a bunch of tasks, and alongside, all JavaScript gets started to load.
The browser can’t break up any tasks that are already initiated. In such cases, bulky JavaScript files could block the main thread completely. As all JavaScript runs on the main thread.
This would end up in an unresponsive web page and hurts the user experience.
What Is Google Recommended Total Blocking Time (TBT) Score:
On mobile devices, your TBT score is calculated by comparing your page’s TBT time to millions of other real sites.
Good TBT (Green) – 0 to 200 milliseconds
Moderate TBT (Orange) – 201 to 600 milliseconds
Poor TBT (Red) – More than 600 milliseconds
How Google Measures Total Blocking Time (TBT):
Any main thread task with more than 50 ms is considered to be a long task. The browser cannot interrupt any task that is in progress (long task), and this happens when the main thread is blocked.
The total blocking time of any page is the sum of blocking time for each long task that occurs between FCP (First contentful paint) and TTI (Time to interactive).

TBT is usually a lab metric that can be understood by auditing the lighthouse performance.
Here is an example of how total blocking time is calculated.
Let us take the main thread has 5 tasks with 200 ms, 100 ms, 50 ms, 30 ms, and 155 ms as task duration.

As we have mentioned earlier, a long task (more than 50 ms) is what is calculated as blocking time.
So, the blocking time are as follows:
Task 1 – 150 ms
Task 2 – 50 ms
Task 3 – 0 ms
Task 4 – 0 ms
Task 5 – 105 ms
So, the Total Blocking Time (TBT) is 305 ms.
How to Check the TBT and the Long Task?
The best way to audit the total blocking time (TBT) is by
- Page Speed Insight
- Chrome DevTools
- Lighthouse
- WebPage Test
Inspect your webpage with a right click. By doing this you get access to Chrome DevTools Performance and Lighthouse. Let’s decode every tool to understand the TBT of the website.
Page Speed Insight:
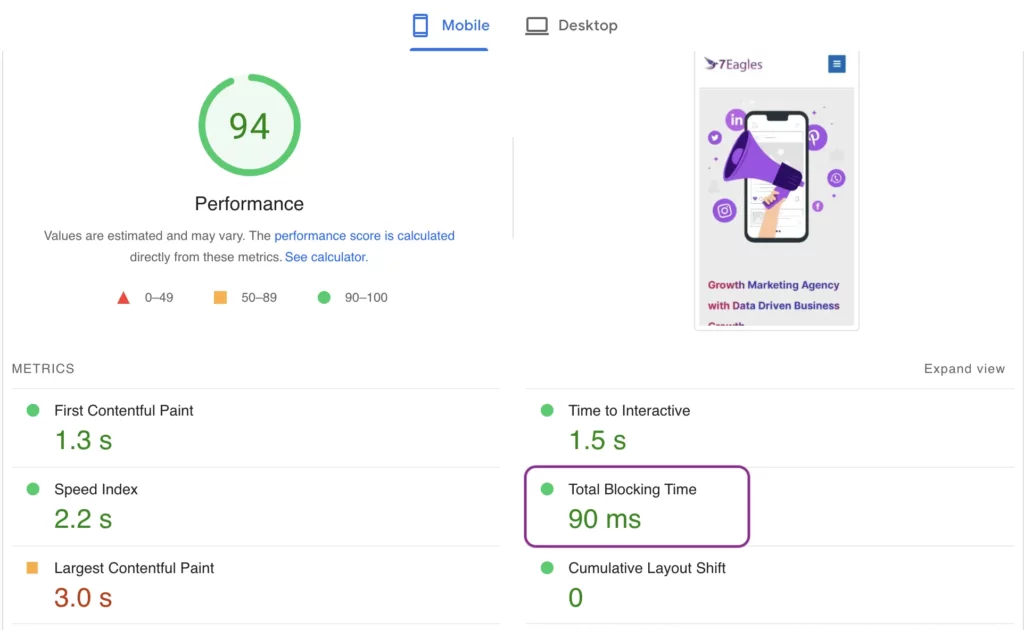
Chrome DevTools Performance Audit:
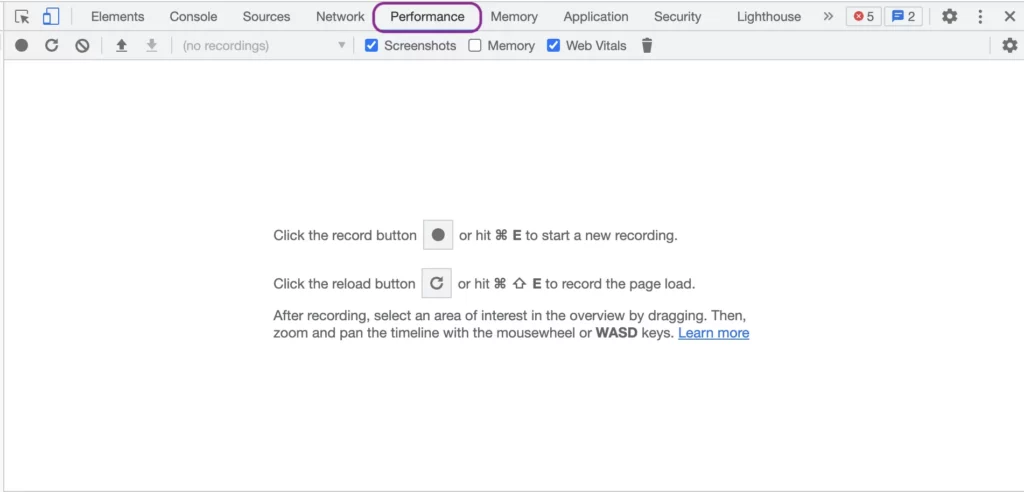
Now, click on the Record button and wait till the chrome browser completes its audit.
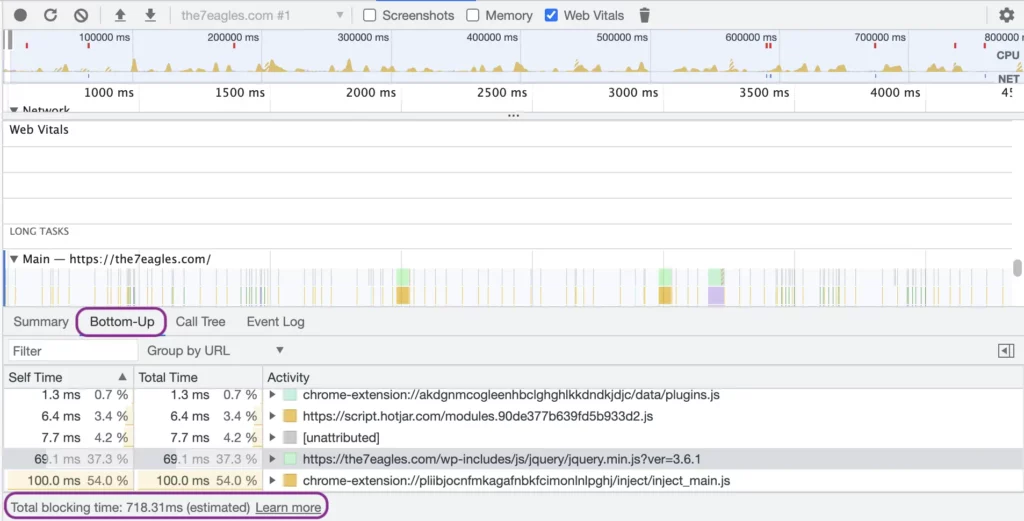
An analysis of the page’s performance will be provided to you. Color-coded tasks appear in the “Main” section. Long Tasks are gray tasks with a small red overlay. Hovering over it will show you how much time it takes.

Post that, you can select the bottom up option to check the detailed description of the long task.
Lighthouse from DevTools:
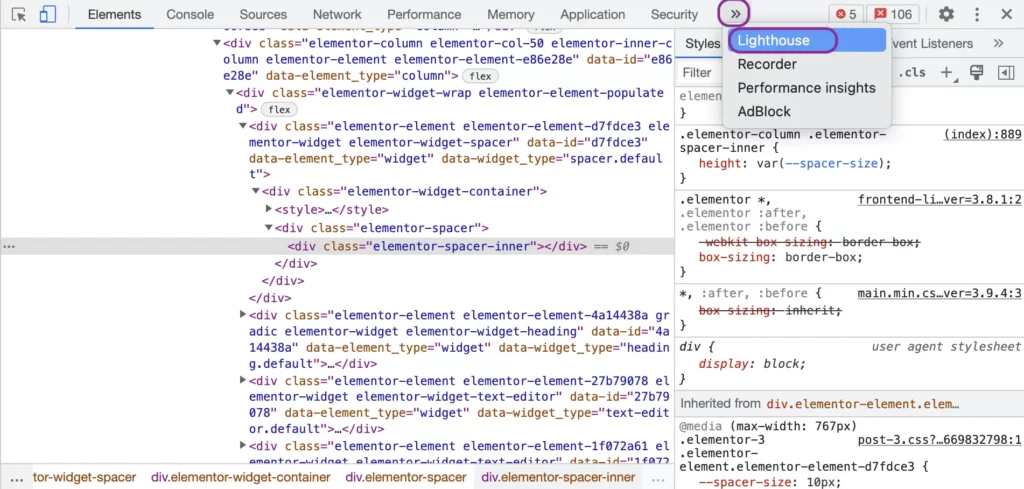
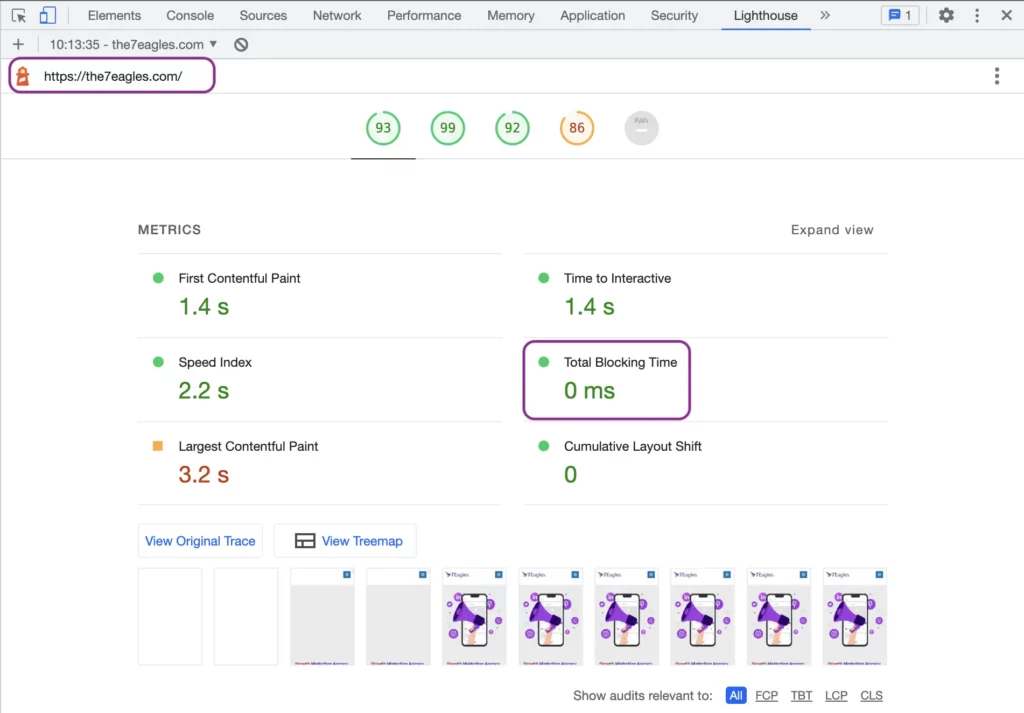
Same as Performance in DevTool, right-click on the chrome browser, and select the option to inspect. You will get the same screenshot as above.
When you press the forward arrow button at the top, you will be provided with various options. Please select lighthouse.
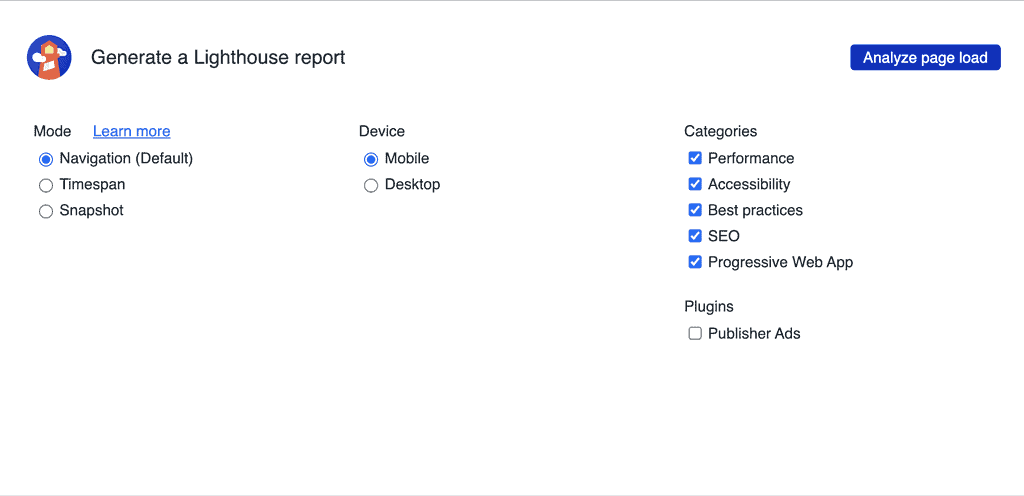
Select all the necessary categories, and press Analyze page load.
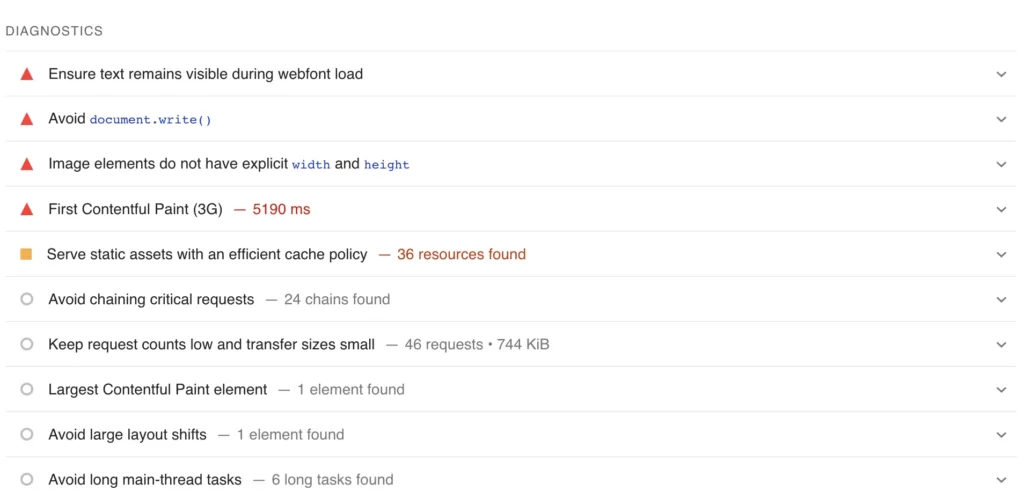
You will get a report of the same as page speed insight with web vital metrics and diagnostic recommendations.
How to Fix Total Blocking Time?
Before moving forward to understand the procedure, you should understand the reason that causes the long task.
- Unwanted JavaScript files and parsing
- High JavaScript execution time
- Heavy main thread loading
- Usage of third party code
Here are a few steps to fix the Total Blocking Time (TBT) issues.
1. Remove or Reduce unused JavaScript files:
JavaScript has a huge role in the long task of the main thread. Having a website with unused JavaScript files can hurt your web page TBT. You can at least make better TBT by removing or reducing unused JavaScript files.
2. Delay JavaScript Execution:
Delaying JS execution improves the page loading speed and reduces the total blocking time (TBT), as it delays all the JavaScript files to load at the same time.
When JavaScript are delayed, they don’t work until users click the buttons or links, or scroll to reach these files.
Delay in JavaScript execution can resolve the avoid chaining critical requests recommendation from the lighthouse.
3. Eliminate Render Blocking Resources:
JavaScript and CSS files are the render-blocking resources. These two resources slow down the rendering of web pages and act as non-critical for the page load.
Basically, third-party tracking codes such as Facebook pixel, Google tag manager, hotjar, etc. are render-blocking resources.
To get page loading speed, render-blocking resources should be eliminated.
4. Minify JS and CSS files:
Minification is the process of compressing bulky code files into a few lines. JS and CSS being bulky files, minifying them could save some loading time.
Minification helps to remove unwanted and redundant data without any changes to the process. This will reduce the total blocking time of the web page.
5. Reduce the Impact of Third-Party Code:
When looking for the best SEO or Core Web Vitals performance, you should avoid multiple third-party codes interacting on your web page.
Cache plugins like WP Rocket or Nitropack can delay these third-party codes.
6. Minimize Main Thread:
The performance report includes a PageSpeed recommendation to minimize main thread work.
The major cause of the main thread is JavaScript files, yet CSS files have their parts.
Minimizing the main thread helps to reduce the total blocking time (TBT).
What Is the Relationship Between TBT and TTI?
TBT (Total blocking time) and TTI (Time to interactive) are associated metrics. It quantifies the degree to which a page is not interactive prior to becoming reliable.
TBT measures the blocking time of all long task caused by JavaScript. In contrast, TTI defines the total time taken for a page to become fully interactive.
Time to Interactive measures interactivity. Among the six metrics measured in your website’s Lighthouse report, TTI is one among them.
Because some sites focus on content visibility at the expense of actual interaction, measuring TTI is crucial. When the user tries to click somewhere, nothing happens: he thinks the site is ready, but nothing happens when he clicks.
An interactive page is marked as fully interactive if the main thread is free of long tasks for about five seconds.
A good user experience requires a Time to Interactive (TTI) of less than 5 seconds.
What Is the Difference Between TBT and FID?
TBT and FID measure the visual interactivity of the web page. But the difference is, total blocking time (TBT) is the lab data and First Input Delay (FID) is the real-world user (field-only) data.
FID is sourced by chrome user experience reports (CrUX), and TBT data is sourced from lighthouse performance. Optimizing Total Blocking Time (TBT) will also improve the First Input Delay (FID) score.
A TBT metric measured in the lab data section can be used when your website does not have enough “real” data to compute the FID score. Based on fixed network conditions, the lab data is artificial and collected from one device.

