While auditing the performance of the website, you may notice the warning says, “reduce the Javascript execution time”, This is because the Javascript in the website is not optimized which increases the page loading speed and affects the user experience.
First, we should understand What Javascript is.
Javascript is a set of instructions or programming languages used to build websites and web applications.
JavaScript execution time is the time taken for the web browser to understand the code and execute the instructions while loading the website.
When the instructions are complex it takes much loading time, when they are simpler it loads the website quickly.
Further down we will explore how to measure and reduce the Javascript execution time.
What is JavaScript Execution Time?
JavaScript execution time refers to the duration it takes for a JavaScript program or script to run from start to finish.
In simpler terms, it’s the amount of time it takes for the computer to process and complete all the instructions written in JavaScript code.
This time can vary depending on factors such as the complexity of the code, the efficiency of the code, the browser in which the code is running, and the capabilities of the device executing the code.
How to Measure JavaScript Execution Time?
You can measure the Javascript execution time in two easy ways, Moreover, many developers use these tools to measure all the webpage performance.
Google PageSpeed Insights
Google PageSpeed Insights is a free tool by Google to measure web page performance and offer optimization suggestions.
Here’s how to use it to measure JavaScript execution time:
- Hop on to the PageSpeed Insights website or you can use the PageSpeed Insights extension for Chrome.

- Enter the URL of the web page you want to analyze
- Click the “Analyze” button.
- PageSpeed Insights will generate a report detailing various performance metrics, including JavaScript execution time
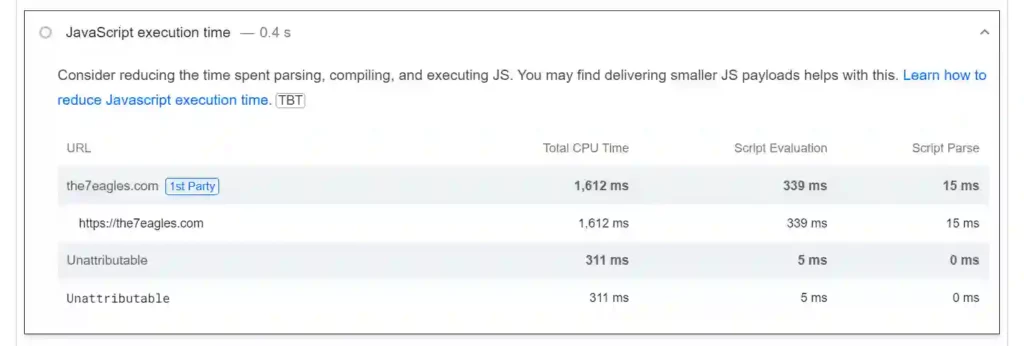
- If you have the warning of reduced Javascript execution time, then follow the recommendations.
GTmetrix
GTmetrix is another popular tool for measuring web page performance, including JavaScript execution time. Follow these steps to utilize GTmetrix for measuring JavaScript execution time:
- Open the GTmetrix website and access the performance testing tool.

- Enter the URL of the webpage and click on Test your site
- After loading for a while, GTmetrix will generate a detailed report containing performance metrics, including JavaScript execution time.

- You can use the insights from GTmetrix to optimize JavaScript code and improve overall web page performance.
How does JavaScript Execution Time Affect Page Performance?
JavaScript execution time has a big impact on page performance Here’s why:
- Blocking the Main Thread: Imagine a one-lane bridge. Cars can only get across one at a time.
Browsers are similar – they have a main thread that handles tasks like loading content, rendering the page, and responding to user clicks.
When JavaScript runs, it takes control of this main thread. If the JavaScript takes a long time to execute, it’s like a slow car blocking traffic.
The browser can’t do other things, like showing you new content or responding to your clicks, making the website feel slow.
- Delayed Rendering:
When you visit a website, you want to see something on the screen as soon as possible. This is called “painting” the content.
Long JavaScript execution times delay this initial painting, leaving users staring at a blank screen, which causes poor user experience.
Javascript execution can block the rendering of the page. When the browser encounters a script tag, it pauses rendering to execute the JavaScript.
If the JavaScript takes a long time to execute, the user might experience a delay in seeing the page content.
- First Input Delay (FID):
This metric measures how long it takes for the website to respond to a user’s first interaction, like clicking a button.
An increase in JavaScript execution time directly affects FID.
If the JavaScript is busy, the website can’t react to user input, making it feel unresponsive, leading to poor user experience
- Memory Consumption:
Like any program, JavaScript code uses memory when it runs. If the code is complex or poorly optimized, it can consume a lot of memory.
This can slow down the entire browser and even lead to crashes, especially on mobile devices with less memory.
- Affects SEO
Search engines like Google take page speed into account when ranking search results.
Slow JavaScript execution can negatively impact page speed, lowering the site’s ranking in search results.
In short, slow JavaScript execution time slows down rendering, increases FID, and can even overload the browser. This all adds up to a poor user experience, which can make visitors leave your website.
How to Reduce JavaScript Execution Time?
Reducing JavaScript is one of the options to improve the webpage performance.
Here are some strategies to reduce JavaScript execution time, making your website faster and more responsive.
1) Implement code-splitting
One effective way to optimize JavaScript execution time is by implementing code-splitting.
This technique involves breaking down your JavaScript code into smaller, more manageable chunks.
Instead of loading all the code at once, you can only load the code needed for a particular page or feature.
For example, suppose your website has separate sections for the homepage, product pages, and checkout pages. In that case, you can split the JavaScript code for each section and load it only when necessary.
This reduces the initial load time and improves overall performance.
2) Remove unused code
Unused code is unnecessary elements to your JavaScript files, which slows down execution time.
It also leads to another warning in website performance as remove unused CSS, so it is important to remove the unused and repetitive codes.
This not only improves performance but also makes your codebase easier to understand for other developers working on the project.
3) Caching your code with the PRPL pattern
The PRPL pattern (Push, Render, Pre-cache, Lazy-load) is a performance optimization technique for web applications, particularly those using JavaScript frameworks like React or Angular.
The PRPL pattern is a strategy to store frequently used JavaScript files so the browser doesn’t have to download them every time you visit a page.
Let’s break down each step:
a) Preloading important JavaScript files:
By preloading required JavaScript files, you can make sure that essential resources are available immediately when needed.
This reduces latency and improves the overall responsiveness of your website.
For example, you can use the <link rel=”preload”> attribute to preload JavaScript files in the <head> section of your HTML document.
b) Rendering the First Paint as soon as possible:
The First Paint (FP) refers to the moment when the browser shows content on the screen.
By prioritizing the rendering of essential content and deferring non-critical tasks, you can achieve a faster First Paint and provide a better user experience.
Techniques like server-side rendering (SSR) or static site generation (SSG) can help optimize the initial rendering process.
c) Pre-caching assets:
Pre-caching involves storing assets such as JavaScript files, CSS stylesheets, and images in the browser’s cache before they are needed.
This allows the next page loads to be faster since the browser can retrieve the cached assets instead of downloading them again from the server.
Service workers, a feature of progressive web apps (PWAs), can be used to implement pre-caching effectively.
d) Lazy-loading JavaScript files:
Lazy-loading is a technique for loading JavaScript files only when they are needed.
This can reduce the initial load time of your website, especially for pages with a lot of content or complex features.
You can lazy-load JavaScript files using dynamic imports or libraries like loadJS or LazyLoad.
4) Minifying and compressing JavaScript code
Minifying and compressing your JavaScript code is another essential step in optimizing its execution time.
Minification involves removing unnecessary characters such as whitespace, comments, and line breaks from your code, reducing its file size.
Compression further reduces the file size by applying algorithms like Gzip or Brotli to compress the minified code.
These techniques improve load times and reduce bandwidth usage, benefiting users with slower internet connections.
WordPress Plugins like WP Rocket and Asset CleanUp help minify and compress Javascript files.
Conclusion:
Optimizing JavaScript execution time is important for delivering responsive web experiences to users.
By implementing techniques like code-splitting, removing unused code, caching with the PRPL pattern, and minifying/compressing JavaScript files you can improve the performance of your website.
The simplest way to reduce the Javascript execution time using appropriate plugins for cleaning and optimizing Javascript files.
Need help in fixing technical SEO errors for your websites which also includes reducing Javascript execution time, check out our technical SEO services, If interested connect with us.

